Performance
Overview
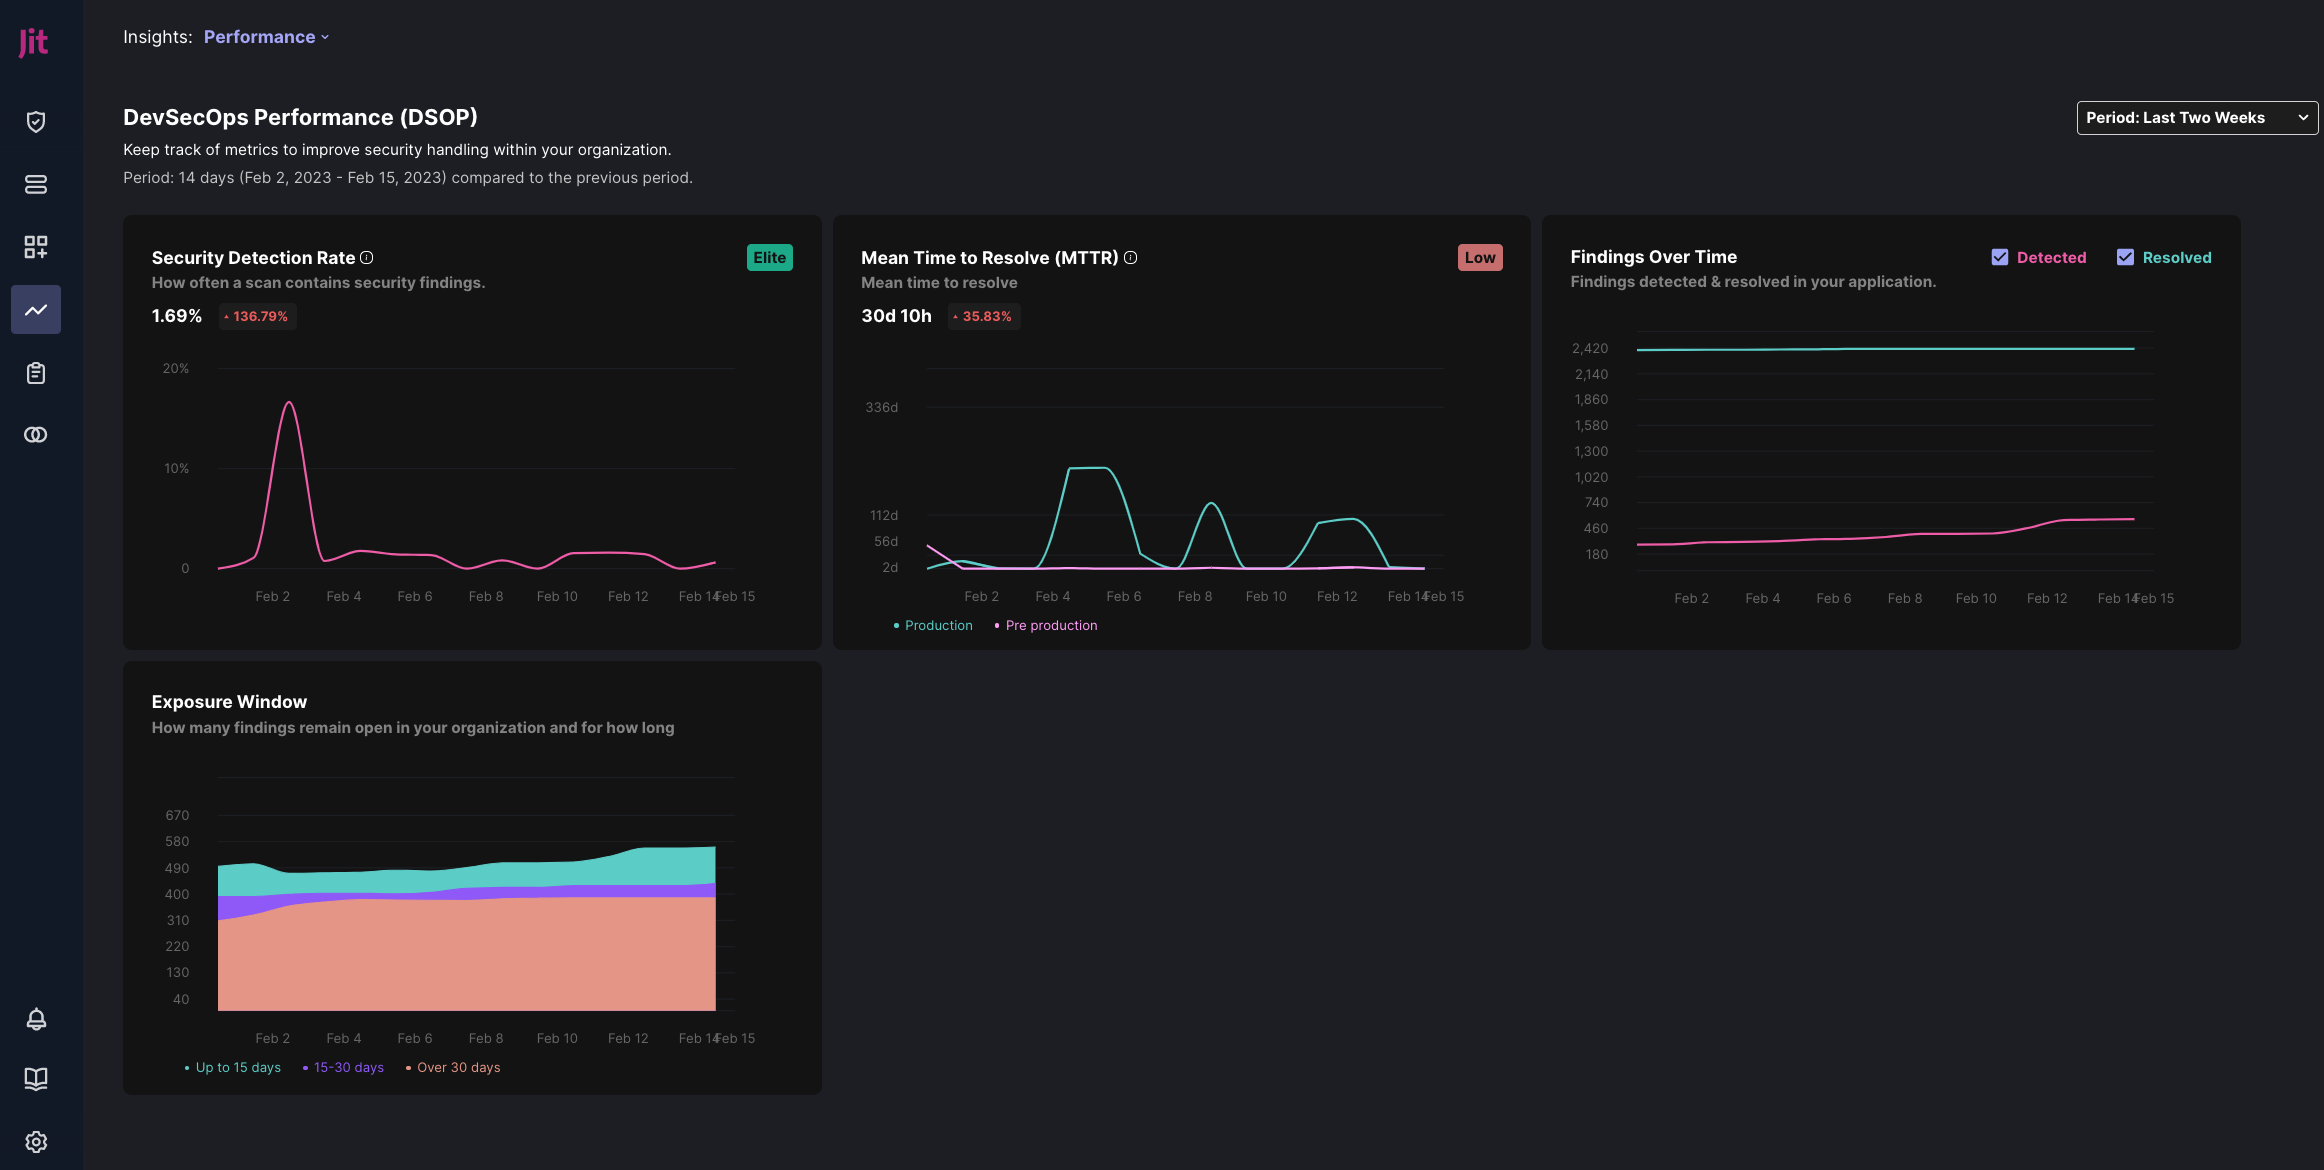
The DevSecOps Performance (DSOP) page provides at-a-glance visualization of key metrics that enable you to track how security is handled in your organization over time.
The Performance page tracks the following metrics—
- Security Detection Rate — The percentage of scans that resulted in security vulnerabilities over the selected period of time. The following scan types are included in this statistic.
- Scans of pull requests that have been merged to the default branch.
- Scheduled scans.
- Mean Time to Resolve — The mean time from detection to resolution of security vulnerabilities over the selected period of time.
- Production — This line shows the mean time to resolve security vulnerabilities that were merged to the default branch.
- Pre-production — This line shows the mean time to resolve security vulnerabilities that were not merged to the default branch.
- Vulnerabilities Over Time — The number of vulnerabilities detected, and the number of vulnerabilities resolved over the duration of your Jit tenant. Vulnerabilities counted in the resolved statistic are excluded from the detected statistic.
- Exposure Window — The number of vulnerabilities that were open on each day included in the selected period of time. Vulnerabilities are sorted into a series of groups, each of which includes all of the vulnerabilities that remained open for the defined period of time— Up to 15, 15 to 30, or over 30 days.
Selecting chart period
Performance charts compare your organization's performance in the current statistical sampling period with the period (of the same duration) that preceded it. To specify the length of these periods, select it from the dropdown in the top right corner of the UI.
Updated 5 months ago